Optical coherence tomography (OCT) operates under the principles of low coherence interferometry (LCI) to provide high-resolution tomographic images of biological samples by coherence gating back-scattered light. In more simple terms, OCT can be described as the optical analogue of ultrasound because it effectively measures optical echoes returning from a sample as a function of depth; but OCT provides much better spatial resolution (1-10 µm), albeit with more limited penetration depth (1-2 mm). Nevertheless, OCT has become a main stay medical imaging technology in fields like ophthalmology, and has shown a lot of promise in other areas of medicine, including cardiology and oncology.
Since its introduction by Huang et al. in 1991 [1], OCT has gone through a number of configurations, of which Frequency domain (FD-) OCT has become the most widely implemented due to the improved acquisition speed and sensitivity [2]. As the name suggests, FD-OCT samples the frequency space of samples, and is hence somewhat analogous to the signal acquired by magnetic resonance imaging (MRI) where the bandwidth of the source dictates the spatial resolution and the sampling frequency dictates the imaging field of view. Thus, a Fourier transform of the interferometric signal yields an A-scan, typically with an axial resolution of a few micrometers and imaging depths of 1-2 mm. Then, multiple A-scans are acquired to generate an OCT image (this process is again more closely related to that of ultrasound).

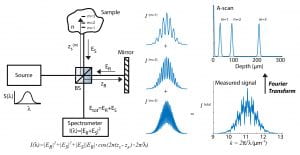
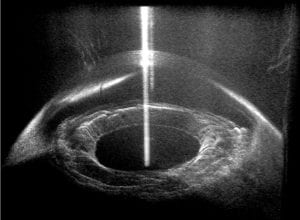
The figure above illustrates a typical FD-OCT system using a Michelson interferometer geometry, where a light source with a wide bandwidth, S(λ), is split into a sample field, E_S, and reference field, E_R; then E_S is incident on a sample with refractive index (RI) n, and E_R is reflected off a reference mirror. In this particular example light is scattered off of three different locations in the sample (m = 1, 2, and 3) and is then recombined with the reference field at the beamsplitter (BS) and detected using a spectrometer. The interferometric signal (i.e., interferogram) is recorded as a function of wavelength and resampled to a linear wavenumber vector, k = 2π / λ . This process enables use of a fast Fourier transform (FFT; which requires linear sampling along the x-axis) to reveal the optical path length difference, ΔOPL = (z_s – z_r)·n, between the scatterers and the reference mirror (labeled depth on the figure). This plot is known as an A-scan.OCT has been particularly successful in ophthalmology due to the optical transparency of the eye in the near-infrared region of the spectrum, thus allowing visualization of retinal layers for diagnosing diseases and assisting in surgeries (example image below). However, OCT has also been used for many other biomedical applications, including cancer detection– but only by way of providing spatial/structural information.

Spectroscopic OCT (SOCT) was introduces as a means to address one of the major limitations of conventional OCT, its lack of molecular specificity [3]. SOCT combines the non-invasive, 3-dimensional (3-D), high resolution, imaging capabilities of OCT with the rich source of knowledge available with spectroscopy by leveraging the wide spectral bandwidth of low coherent light sources required for depth sectioning via the coherence gating process. In fact, SOCT uses the same data acquired for conventional OCT imaging, but provides spectral information at each voxel of the sampled volume, revealing the wavelength-dependent attenuation (absorption and scattering) of light traversed through the biological medium. This technique, along with advanced signal-processing methods, was used to quantify hemoglobin (Hb) concentration and saturation in-vivo, which are valuable biomarkers that can help improve our understanding of tumor development (e.g., angiogenesis and hypoxia) among other applications [4-6].

References:
[1] Huang, D., Swanson, E. A., Lin, C. P., Schuman, J. S., Stinson, W. G., Chang, W., et al. (1991). Optical coherence tomography. Science, 254 (5035), 1178–1181.
[2] Choma, M. M., Sarunic, M. M., Yang, C. C., & Izatt, J. J. (2003). Sensitivity advantage of swept source and Fourier domain optical coherence tomography., 11(18), 2183–2189. http://doi.org/10.1364/OE.11.002183
[3] Morgner, U., Drexler, W., Kärtner, F., Li, X., Pitris, C., Ippen, E., & Fujimoto, J. (2000). Spectroscopic optical coherence tomography. Optics Letters, 25(2), 111–113.
[4] Robles, F., Graf, R. N., & Wax, A. (2009). Dual window method for processing spectroscopic optical coherence tomography signals with simultaneously high spectral and temporal resolution, 17(8), 6799–6812.
[5] Robles, F. E., Chowdhury, S., & Wax, A. (2010). Assessing hemoglobin concentration using spectroscopic optical coherence tomography for feasibility of tissue diagnostics. Biomedical Optics Express, 1(1), 310–317. http://doi.org/10.1364/boe.1.000310
[6] Robles, F. E., Wilson, C., Grant, G., & Wax, A. (2011). Molecular imaging true-colour spectroscopic optical coherence tomography. Nature Photonics, 5(12), 744–747. http://doi.org/10.1038/nphoton.2011.257