Phase microscopy allows us to visualize weakly absorbing and scattering (i.e., transparent) objects, such as cells. Advances have led to the development of quantitative phase imaging (QPI), which allows us to not only visualize transparent cells but also quantify their optical thickness (sample thickness x refractive index (n)), now at very fast speeds. This phase measurement is of biological importance because it is linearly related to the dry-mass content (e.g., proteins), thus enabling the study of cell mass growth and mass transport [1].
Recently, the wavelength-dependence of the refractive index (a property known as dispersion) has been used to quantify biochemical properties of cells [2-6]. This approach exhibits important characteristics: (1) Dispersion can be used to independently assess the weakly absorbing and scattering properties of cells, which is not possible using conventional microscopy methods [5]. (2) Dispersion measurements are immune to laser intensity fluctuations, which can hamper quantification of biochemical properties using other methods [6].
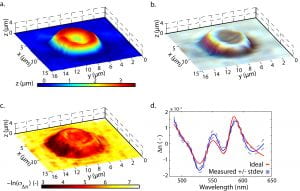
The figure below illustrates the molecular imaging capability of phase microscopy combined with dispersion spectroscopy: In this example, the same data were processed to yield the dispersive properties of a single red blood cell (RBC), and quantitative phase maps (which gives the cell volume) to quantify hemoglobin concentration and oxygen saturation with subcellular resolution. Here the dispersion information provided two orders of magnitude greater sensitivity to the molecular information [6].

References:
[1] Mir, M., Bhaduri, B., Wang, R., Zhu, R., & Popescu, G. (2012). Quantitative Phase Imaging. Progress in Optics (Vol. 57, pp. 133–217). Elsevier Inc. http://doi.org/10.1016/B978-0-44-459422-8.00003-5
[2] Park, Y., Yamauchi, T., Choi, W., Dasari, R., & Feld, M. (2009). Spectroscopic phase microscopy for quantifying hemoglobin concentrations in intact red blood cells. Optics Letters, 34(23), 3668–3670.
[3] Pham, H., Bhaduri, B., Ding, H., & Popescu, G. (2012). Spectroscopic diffraction phase microscopy. Optics Letters, 37(16), 3438. http://doi.org/10.1364/OL.37.003438
[4] Rinehart, M. T., Park, H. S., Walzer, K. A., Chi, J.-T. A., & Wax, A. (2016). Hemoglobin consumption by P. falciparum in individual erythrocytes imaged via quantitative phase spectroscopy. Scientific Reports, 6, 1–9. http://doi.org/10.1038/srep24461
[5] Robles, F. E., & Wax, A. (2010). Separating the scattering and absorption coefficients using the real and imaginary parts of the refractive index with low-coherence interferometry. Optics Letters, 35(17), 2843–2845.
[6] Robles, F. E., Satterwhite, L. L., & Wax, A. (2011). Nonlinear phase dispersion spectroscopy. Optics Letters, 36(23), 4665–4667. http://doi.org/10.1364/OL.36.004665